Better information on the environment through automatic water quality monitoring
Continuous sets of data from automatic water quality monitoring ënables more accurate nutrient loading estimates than traditional grab sampling, which often shows prolonged periods of no observations. When brought together with modern, fast data transfer protocols and online web-services, automatic measurements may improve citizens’ access to real-time information on the environment.
The main objectives and purpose of the automatic monitoring typically are to test a new measurement method and to verify its reliability. This, however, requires that the quality assurance of the entire automatic monitoring system is appropriately taken care of.
One of the aims of the SEVIRA project was primarily to test the operation of a continuous water quality measuring station in a transboundary (Finland–Russia) river. Another goal was to make recommendations on how to make the measurements functional and reliable.
Rakkolanjoki catchment area
- The cross-border catchment (215 km2) is located in South-Eastern Finland and North-Eastern Russia. The 33 km long river Rakkolanjoki drains the watershed into the Bay of Vyborg in the Gulf of Finland.
- In terms of land use in the area
- forest (62%) is the dominant class,
- agricultural areas (11%) are concentrated in the northern parts of the catchment in the Finnish side, on mostly clayey soils
- urban areas – mostly by the Finnish town of Lappeenranta – cover 7% of the Rakkolanjoki catchment,
- waterlogged areas occupy 6% and wetlands 2% of the catchment.
- In the Rakkolanjoki catchment there is one major source of point pollution, i.e. the wastewater treatment plant of the Lappeenranta town (72 000 inhabitants).
- Within the Finnish side of the catchment there are 1 343 people living in properties not connected to the sewer networks, i.e. with onsite wastewater treatment.
- On top of this, there are 72 summer cottages.
|
Water-sampled data of the river
The available water quality data of the river Rakkolanjoki, as measured at both sides of the border during 2018–2021 were examined in the SEVIRA project. The Finnish monitoring site was titled Rakkolanjoki and the Russian one closest to the border Kutuzovo and the one with automatic monitoring devices Lugaika.
The results revealed that the nutrient concentrations were higher in the Finnish side than in the Russian side. The dissolved fractions constituted higher share of total phosphorus (Ptot) and total nitrogen (Ntot) in the Finnish than in the Russian stations. For example, dissolved phosphorus (DP) concentration constituted more than half of the total phosphorus concentration at the Rakkolanjoki site, while at Kutuzovo and Lugaika sites it was only one-fifth. The difference may be, on the one hand, due to the differences in the laboratory analysis methods and to the numbers of the analyzed samples. On the other hand, dilution may have occurred in Russian side between the Finnish Rakkolanjoki and the Russian Lugaika monitoring sites.
In terms of nutrient loading, the difference was also apparent. For example, in 2019 Ptot load was 6 600 kg at the Rakkolanjoki site and 4 700 kg at the Lugaika site.
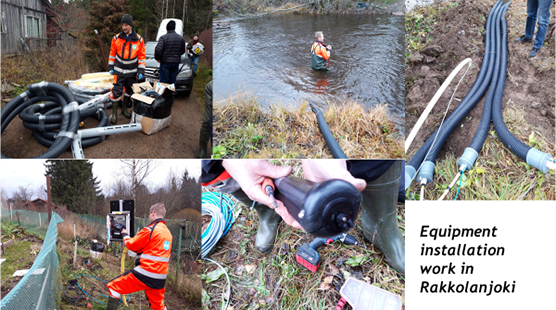
Setting up the monitoring system in the Russian side of the river. The on-line water quality measurement devices were installed in the river Rakkolanjoki on October 24th, 2019. The observation station measured turbidity, electrical conductivity, organic carbon, chlorophyll-a and nitrate-nitrogen with one-hour-frequency.
Automatically measured turbidity as a surrogate for phosphorus and solids
At first there were examined the correlations of turbidity against Ptot and total suspended solids (TSS) concentrations, and thus checked how well turbidity could be used as a surrogate for TSS and Ptot.
The results on the Finnish monitoring site showed that while turbidity correlated reasonably well with TSS, the correlation was weak with Ptot. The weak correlations between TSS and Ptot at Kutuzovo and Lugaika indicate that turbidity would not be very good surrogate of Ptot there, either.
The examinations of correlations between combined nitrite-nitrate nitrogen (NO23) and Ntot showed higher dependencies than those with turbidity-TSS-Ptot.
Seasonal challenges
During the ice breaking time 2020, two of the sensors (turbidity, electrical conductivity) loosened from the mounting stands. Therefore, there was a two-week-gap in March 2020 in the measurement series.
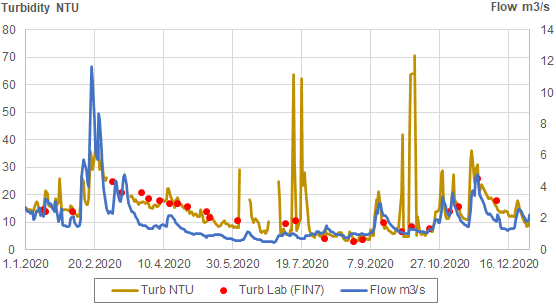
In summer 2020, water in the river Rakkolanjoki was occasionally full of brown mush mixed with water. There were mush throughout the whole water profile, which apparently caused increasing turbidity. Although the turbidity sensor was equipped with mechanical brush cleaning, it obviously was not sufficient to keep the optical lens thoroughly clean (see the figure and graph below). In such situations, it is difficult to say whether these high turbidity values really represent the water quality or not.
In summer, we also noticed signs of “crawling/creeping” phenomenon in chlorophyll-a and organic carbon measurements. By crawling/creeping we mean gradual increase of the measured variable, which drops down immediately after the manual cleaning of the sensor.
Lessons learned
The goals of the SEVIRA project included testing the use of a continuous water quality meter in Russia and finding out what benefits continuous measurements may bring compared to traditional water sampling. We noticed that the continuous water quality time series include data that can be utilized both in modelling and in nutrient load calculations. Unfortunately, there were some gaps in the measurements due to the challenging conditions, including Covid-19 pandemic.
More information